Structured Prosopography provides a formal model for representing prosopography: a branch of historical research that traditionally has focused on the identification of people that appear in historical sources (Verboven et al. 2007). Thanks to computing technologies, structured prosopography has succeeded in providing historians with a mean to enhance their scholarly work and make it available worldwide to a variety of academic and non academic users. Since the 1990s, KCL’s Department of Digital Humanities (DDH) has been involved in the development of structured prosopographical databases, and has had direct involvement in Prosopographies of the Byzantine World (PBE and PBW)1, Anglo-Saxon England (PASE)2, Medieval Scotland (PoMS)3 and now more generally northern Britain (BoB).4
Pre-digital print prosopographies presented its materials as narrative articles about the individuals it contains. Structured prosopography instead takes a more database-oriented approach as it focuses on isolating information fragments (usually, in textual form) that are relevant to the task of describing the life-events of a particular person. As a result, it is possible to quickly recollect such results in manifold ways using the logical query languages database systems make available.
In particular, DDH has been involved in the development of a general ‘factoid-oriented’ model of structure that although downplaying or eliminating narratives about people, has to a large extent served the needs of these various projects quite well. The structure formally identifies obvious items of interest: Persons and Sources, and extends to related things like Offices or Places. In our prosopographical model the Factoid is a central idea and represents the spot in a primary source where something is said about one or more persons. In other words, it links people to the information about them via spots in primary sources that assert that information (Bradley & Short 2003).
In general, it is fair to say that the issue of representing prosopographical data to the purpose of building large and efficient knowledge bases is no longer a critical problem for digital humanities research to tackle. Thanks to more than twenty years of research in this niche-area, a number of technical approaches such as the factoid one just mentioned have been discussed extensively and thus can facilitate enormously the initial design and construction of a structured back-end for a digital prosopographical project.
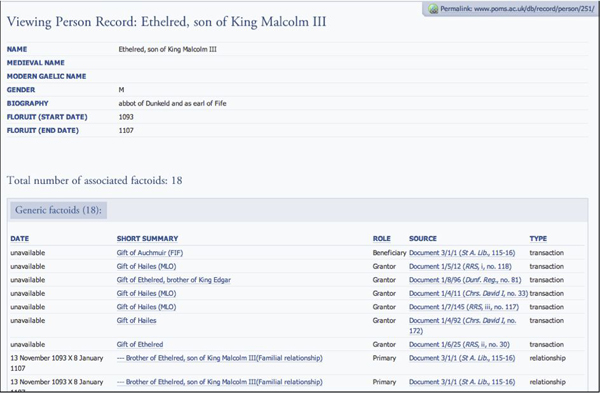
For that regards instead the visual rendering and final presentation of the contents of a prosopography, the amount of existing research is considerably smaller5. In fact it is quite common to present data using a classic database-centric approach: the tabular format. This approach normally boils down to a bibliographical-record-like table containing all the information available about a specific person: his/her recorded appellations and life dates, plus of course a variable number of rows that refer to the excepts that describe that person in the primary or secondary sources examined. We can see an example of this classic visualization approach in Fig. 1 (the example can be found online at http://www.poms.ac.uk/db/record/person/251/).

Figure 1: A typical prosopographical record in tabular format
The tabular format has the advantage of offering a wealth of information in a clean and well-organized interface, thus simplifying the task of finding what we are looking for during a search. However, by combining all the information in a single view, this approach also hides some of the key dimensions used by historians in order to make sense of the materials at hand. For example, such dimensions could be deriving from a spatio-historical, genealogical or socio-political consideration of the data.
In other words, we acknowledged that although the tabular format succeeds in creating a comprehensive and condensed version of the information relevant for a search, it would also be interesting to examine if we could present the same data in a more piecemeal fashion, according to predefined pathways or views on the dataset that aim at making explicit some of the coherence principles of the historical discourse.
We believe that this kind of approach could be desirable for both non-expert users (e.g., learners) – who could simultaneously access the data and get a feeling for the meaningful relations among them – and for experts alike (e.g., academic scholars) – who could be facilitated in the process of analyzing data within predefined dimensions, so to highlight patterns of interest that would be otherwise hard to spot.
With these ideas in mind we started to investigate the creation of innovative methods for presenting prosopographical data to users. For the moment these experiments have been developed in the context of a single prosopography, the ‘Paradox of Medieval Scotland’, but we reckon that they could be easily generalizable to other projects too, due to the intrinsic similarity of the approaches we used.
In particular, we have classified these exploratory tools into three broad categories:
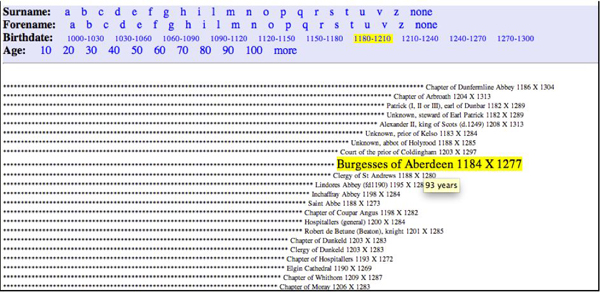
- Visualizations that focus on specific aspects of the dataset. In this group we have for example visualizations of people that focus on the historical dimension (such as timelines, or views of people’s longevity – as in Fig. 2 below) or the geographical one (e.g., through maps). Also, we can have visualizations that aim at representing the importance of a person in the context of the database i.e., in terms of how often that person is cited. Other visualization approaches such as tag clouds seem to be very relevant in this context too, as they can be customized so to contain visual cues (e.g., through size or color) that give users a quick overview of the data (Bateman et al. 2008).
- Digital storytelling systems. With this term we refer to the class of interactive applications aiming at letting users explore the database contents in a more incremental manner, following a story-inspired approach that reflects the key coherence principles of a discipline (Mullholland et al. 2004; Lawrence et al. 2010). For example, the ‘friend-of-a-friend’ exploratory tool (Fig. 3) lets you inspect the available connections between one person and the other people he or she was involved with (obviously, based on the information available in the database). This procedure may lead to dead-ends – for we are looking at a less-known person, e.g., a peasant – or it may take you to the discovery of unanticipated relations among people. This approach can be further elaborated so to pivot around specific social relationships (e.g., witnesses in medieval transactions), to the point that the path a user takes become analogue to the unfolding of a story only partly commanded by the computer (Murray 1997).
- Game-like interactive systems. This group of interactive applications are a direct evolution of the digital storytelling systems just introduced (point b), with the difference that a series of user-feedback mechanisms are put into place with the aim of pushing users to engage more actively with the system (e.g., by rewarding certain decisions they make). These approaches are normally more relevant in the context of a classroom, where it is important to provoke students with challenging and mind-stimulating activities (Wolff et al. 2004).
The experiments can be accessed online at http://www.poms.ac.uk/db/labs/; we invite the reader to try them out so to better develop a critical understanding of their potential usefulness.
Although we are still in a very early stage in the development of such exploratory interfaces, we already had a number of enthusiastic early reviews from project partners and work colleagues. As a result of this initial response, and from the evolution of our thinking around these issues, we are currently refining some of these tools and also developing other and more specialized ones. For example, an interesting aspect we would like to explore further concerns the potential applicability of the approaches herewith presented within other prosopographical scenarios, such as the ones focusing on ancient and modern history. Furthermore, in order to gain more empirical evidence on the potential usefulness of these tools for historians, a more formal user-evaluation session involving both high-school students and academic scholars is being planned.
At the conference we intend to present a preliminary analysis of these results, together with a practical demonstration of the most successful prosopographical exploratory tools we developed.

Figure 2: Explorative tool based on people’s life-lengths. Each dot represents a year in the lifeline of a person.

Figure 3. Explorative tool based on the social connections among people. Each indented level (top to bottom) represents a step in the ‘friend-of-a-friend’ chain.
References
Bateman, S., C. Gutwin, and M. Nacenta (2008). Seeing things in the clouds: the effect of visual features on tag cloud selections. In HT ’08: Proceedings of the nineteenth ACM conference on Hypertext and hypermedia. New York, NY, pp. 193-202.
Bradley, J., and H. Short (2003). Texts into databases: The Evolving Field of New-style Prosopography. ACH/ALLC conference, Athens, Georgia.
Lawrence, K. F., et al. (2010). Scanning Between the Lines: The Search for the Semantic Story. Panel Session in Digital Humanities 2010.
Mullholland, P., T. Collins, and Z. Zdrahal (2004). Story Fountain: intelligent support for story research and exploration. In 9th International Conference on Intelligent User Interface.
Murray, J. H. (1997). Hamlet on the Holodeck. MIT Press.
Verboven, K., M. Carlier, and J. Dumolyn (2007). A Short Manual to the Art of Prosopography. In K. S. B. Keats-Rohan (ed.), Prosopography Approaches and Applications A Handbook. University of Oxford, Linacre College Unit for Prosopographical Research.
Wolff, A., P. Mullholland, and Z. Zdrahal (2004). Scene-driver: a narrative-driven game architecture reusing broadcast animation content. In ACM SIGCHI International Conference on Advances in computer entertainment technology.
Notes
4.http://www.breakingofbritain.ac.uk/
5.The Berkeley Prosopography Services toolkit (http://berkeleyprosopography.org/) is one of the very few enterprises that aim explicitly at the investigation of alternative visualization mechanisms in digital prosopography. However at the time of writing the results of this research have not been made available yet.

