
Introduction
This paper uses the database of the Historical Thesaurus of English (Kay et al. 2009; hereafter abbreviated to HT) to visualize change in the history of English, and in particular in the English lexicon. The HT, published in 2009, is the world’s largest thesaurus and the most complete thesaurus of English, arranging into hierarchical semantic categories all the recorded meanings expressed in the language from Anglo-Saxon times to the present. The underlying HT database (see Kay & Chase 1987; Wotherspoon 1992), held at the University of Glasgow, is a massive computational resource for analyzing the recorded words of English with regards to both their meaning and dates of use.
The present paper describes a methodology of visualizing English using data from the HT, developed from an earlier pilot project (Alexander 2010). By combining visualization techniques with the high-quality humanities data provided in the HT, it is possible to give scholars a long-range view of change in the history, culture and experiences of the English-speaking peoples as seen through their language.
The Data
The data stored within the HT is a fine-grained conceptual hierarchy containing almost all of the recorded words in English, arranged semantically. Each category of words is nested within other, wider categories, so that, for example, the verb category Live dissolutely is within Licentiousness, itself adjacent to Guilt and Rascalry and within the wider category Morality. This hierarchical structure differs from the organization of many other thesauri; HT categories relate to others not just linearly, but can operate either horizontally (on the same hierarchical level) or vertically (on a higher or lower level, either containing or being contained by another category). In addition, each concept is able to contain a series of subcategories within itself, separate from the main sequence. It is this complex hierarchical structure which helps make the HT database so useful for visualization: each individual point in the hierarchy can contain both word entries for the concept represented by that point, and also all the conceptual descendants which follow it, each surrounded by siblings of similar meaning.
The size of the HT also makes it amenable to computational analysis. The current version of the database (as of mid 2011) contains 793,747 entries, compared to OED2’s 616,500 (Algeo 1990: 137), all within 236,346 categories, each representing a distinct concept. Taking into account each field stored within it, the database itself contains approximately 22.7 million pieces of data.
Visualization
The normal metaphor for visualizing hierarchy is a tree-like system, like that often used in organisation charts. HT data is, however, far too large to be used in such a way – even a spider-like tree or hypertree could not represent the thesaurus, whose largest category alone (the adverb Immediately) contains over 250 synonyms.
Instead, the present paper will describe an alternative way of displaying the HT hierarchy, representing each category as a nested rectangle on a plane. This technique produces a ‘treemap’ (see Shneiderman 2009), wherein each entry in a hierarchy is represented by a rectangle which is large enough to contain smaller rectangles representing its descendants while simultaneously being itself small enough to nest within further rectangles representing its parent categories. In short, a treemap structure takes the organisational chart metaphor of senior is up and replaces it with senior is big.
Doing this for the full hierarchy of the HT lets us view the semantic structure of the English language as a whole. Figure 1 is therefore a treemap showing all of present-day English in the HT, with every word represented by a small dot of ink. Those black dots are present-day words which originated in Old English, and white dots represent those which entered the language much more recently. The map is arranged by semantic field, so words in close semantic proximity are also physically close to one another on the diagram. An interactive display of this visualization allows an analyst to see which areas correspond to which categories and lexemes.
Patchworks and Field-Boundaries
One effect which is visible from Figure 1 is that modern English has a ‘patchwork’ effect in the visualization. Areas such as Physics and Chemistry are quite light, as are parts of Number (which includes Mathematics) and Language. This phenomenon makes it possible to visually view the areas where the English language has ‘stretched’ in order to accommodate new vocabulary. These light patches within the greater patchwork are areas of recent lexical innovation, made up of clusters of words first cited in the OED and recorded in the HT from recent years. Therefore, we would expect this patchwork effect in areas affected by rapid social, technological or academic growth, such as Computing (inside Number, adjacent to Mathematics), Physics, Chemistry, Linguistics, Communication, Travel, and so on. Conversely, darker and therefore older patches cover existence in Time and Space, Creation, Causation, Faith, Emotion, and the parts of Number which refer to Arithmetic or Enumeration.
This effect is pronounced in present-day English, but if other selections of the data are taken, it reduces somewhat. If the present-day data is thought of as a ‘slice’ of the HT, then other such slices can be taken between the Old English period and the present day. Other slices reveal that this patchwork effect, with its pronounced edges between new and old semantic fields, do not occur throughout the rest of the history of the language. Proceeding backwards from the present day through the Late Modern, Early Modern and Middle English periods, there is a visible reduction in the patchwork effect observed above, so that by Middle English almost no delineated rectangular patches of innovation can be found. The paper compares these slices and offers an interpretation of various areas of patchwork and patchwork-like effects across time, which, as a result of rapid growth, generally indicates fundamental and rapid progress in the context of the language.
Conclusion
In the ways outlined above, such visual displays of HT data can provide useful entry points to a large, complex lexicographical and lexicological dataset. Firstly, in a pedagogical sense, these displays can give students and the public a new way of looking at humanities data, and of exploring them interactively. Secondly, as computer displays and online dictionary interfaces become more polished, new ways of encouraging exploration of lexical data online are needed to replace the lost experience of browsing a printed dictionary, rather than only providing users with a blank search interface. And finally, such visualizations can point analysts towards areas of possible semantic, lexical or cultural interest, whether areas of trauma in the history of the language, areas of rapid growth, or areas of relative stability. The paper will conclude by demonstrating some of these, including ‘slices’ of the data giving visualisations of various points in the history of English (eg in the time of Chaucer or Shakespeare), and in illustrating lacuna in our knowledge of earlier periods of the language, and will outline areas of future development of this approach.
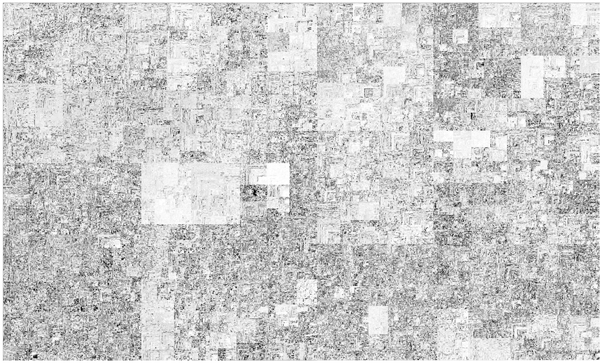
Figure 1: Present-day English from the HT, shaded by first cited date
References
Alexander, M. (2010). ‘The Various Forms of Civilization Arranged in Chronological Strata’: Manipulating the Historical Thesaurus of the OED. In M. Adams (ed.), ‘Cunning passages, contrived corridors’: Unexpected Essays in the History of Lexicography. Monza: Polimetrica.
Algeo, J. (1990). The Emperor’s New Clothes: The second edition of the society’s dictionary. Transactions of the Philological Society 88(2): 131-150.
Kay, C., and T. J. P. Chase (1987). Constructing a Thesaurus Database. Literary and Linguistic Computing 2(3): 161–163.
Kay, C., J. Roberts, M. Samuels, and I. Wotherspoon (2009). Historical Thesaurus of the OED. Oxford: Oxford UP.
Shneiderman, B. (2009). Treemaps for space-constrained visualization of hierarchies. http://www.cs.umd.edu/hcil/treemap-history/index.shtml (accessed 26 October 2011).
Simpson, J., and E. Weiner, eds. (1989). The Oxford English Dictionary, 2nd. ed. Oxford: Oxford UP.
Wotherspoon, I. (1992). Historical Thesaurus Database Using Ingres. Literary and Linguistic Computing 7(4): 218-225.